⚙️ System Services
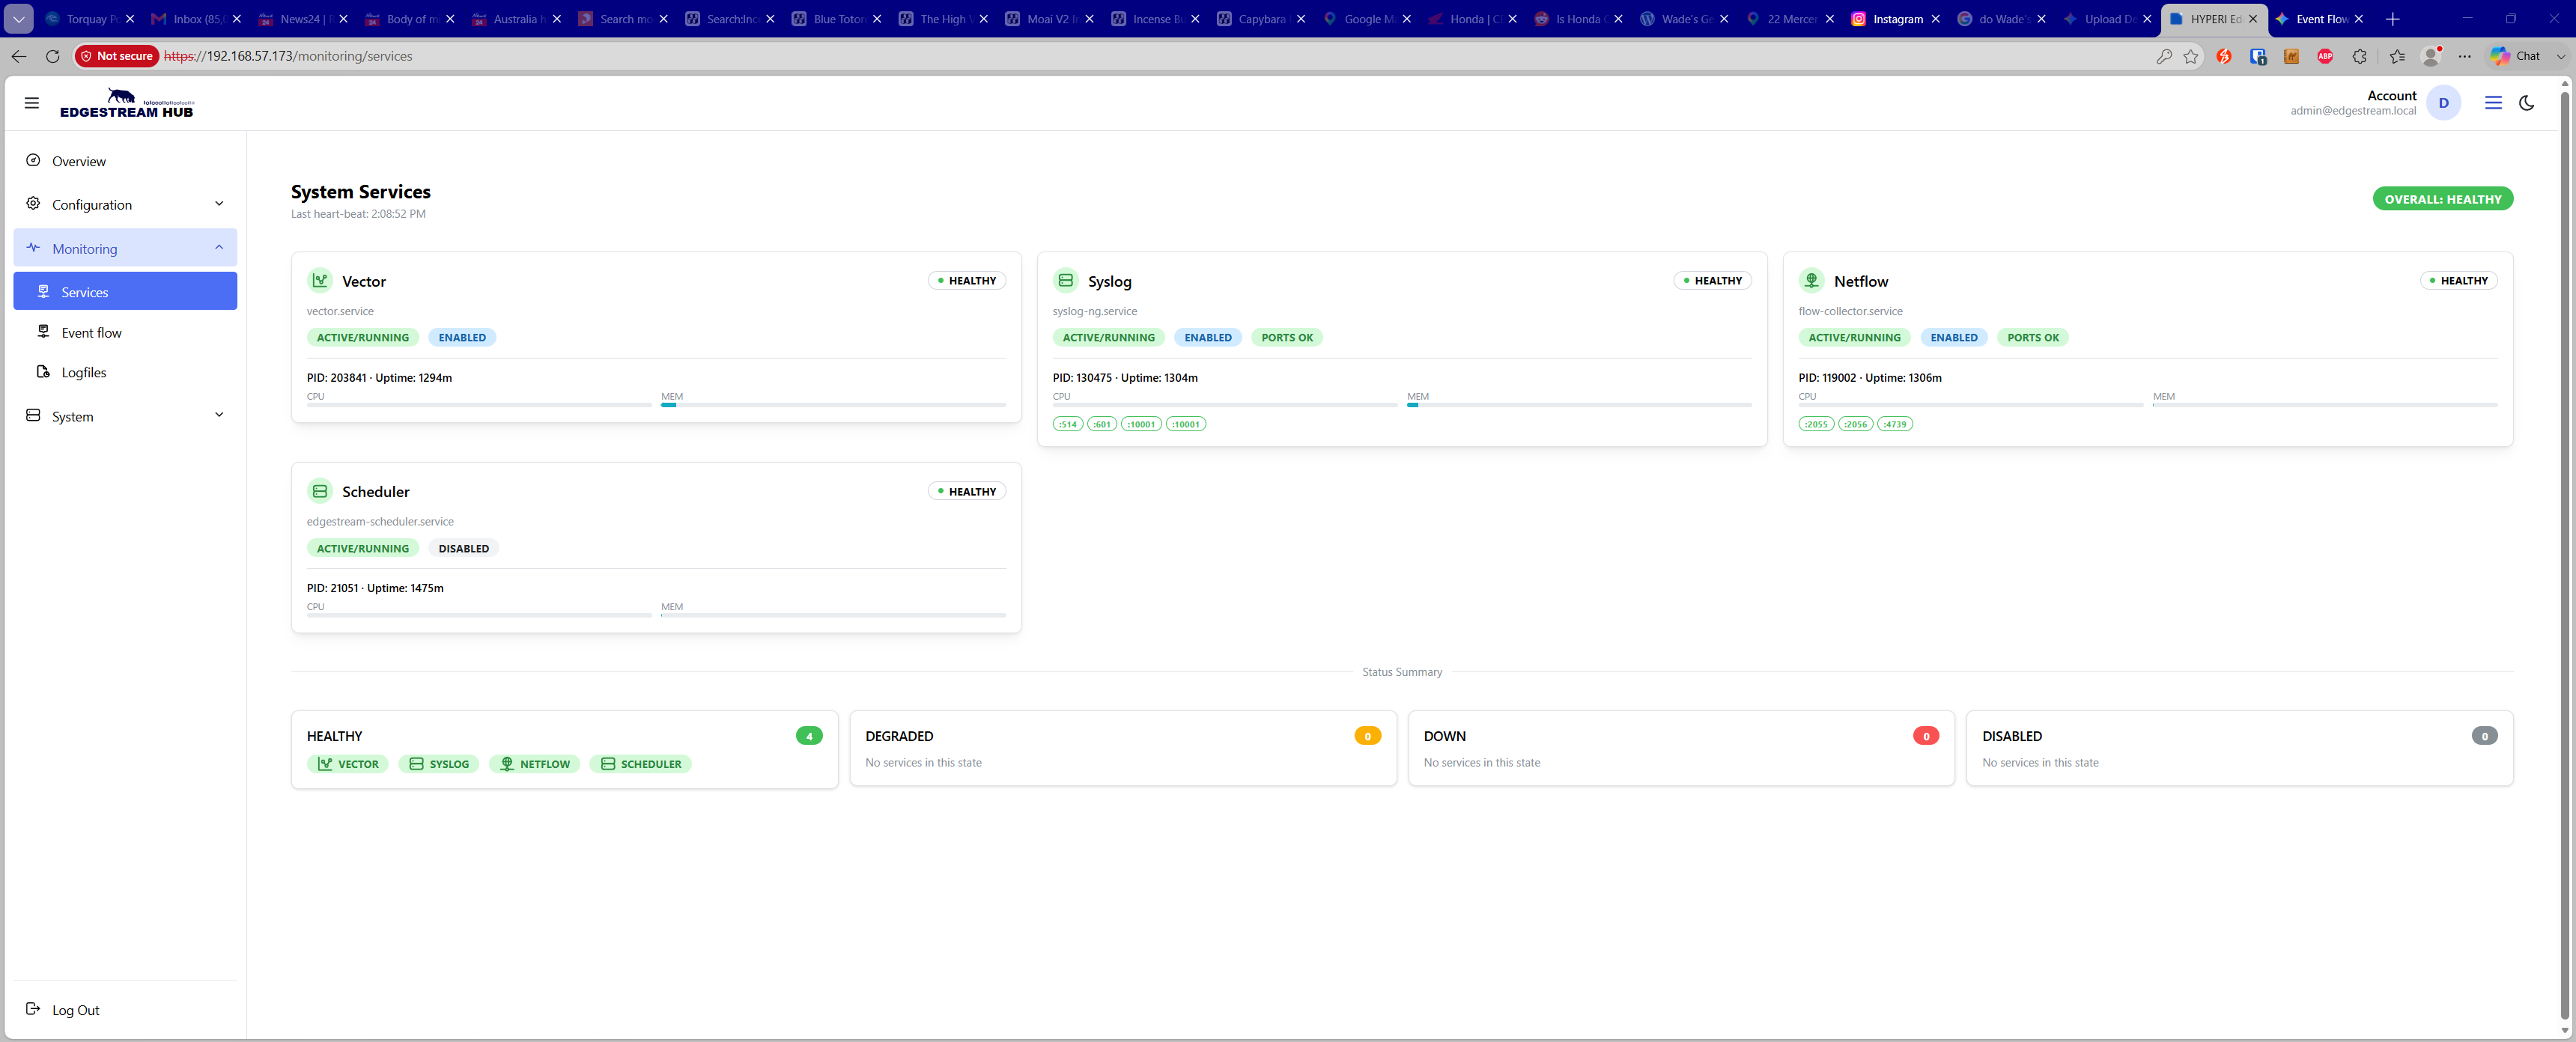
The System Services page provides a centralized, real-time monitoring view of all core daemons powering the EdgeStream Hub appliance.
🚦 Service States & Status Indicators
The health of each service is evaluated continuously via heartbeats and classified into one of four states:
Healthy (Green) — The service is running, responsive, and operating within expected operational thresholds.
Degraded (Yellow) — The service is active but encountering warnings, partial port binding issues, or performance constraints.
Down (Red) — The daemon has stopped unexpectedly, failed to bind to necessary sockets, or crashed.
Disabled (Gray) — The service has been intentionally toggled off by an administrator and is not actively processing traffic.
🎛️ Monitored Services
Each service card displays operational runtime information, including the system daemon name, process ID (PID), service uptime, real-time CPU and memory usage, and listening port bindings:
Vector (
vector.service) — Core telemetry ingestion, transformation, and routing pipeline engine.Syslog (
syslog-ng.service) — High-throughput syslog daemon listening on standard and configured network ports (e.g.,:514,:601,:10001).Netflow (
flow-collector.service) — Dedicated network telemetry collector for NetFlow and IPFIX traffic (e.g.,:2055,:2056,:4739).Scheduler (
edgestream-scheduler.service) — Background worker responsible for automated configuration backups, log retention routines, and periodic maintenance tasks.
📋 Status Summary Panel
Located at the bottom of the page, the Status Summary panel groups services by their current operational state:
Provides a quick count of total services across all four status states (Healthy, Degraded, Down, and Disabled).
Displays interactive badges for quick visual assessment and rapid isolation of offline or degraded processes.