🔀 Event Flow Monitor
The Event Flow Monitor provides real-time visibility into telemetry throughput, pipeline performance, and error states across configured sources, transforms, and destinations.
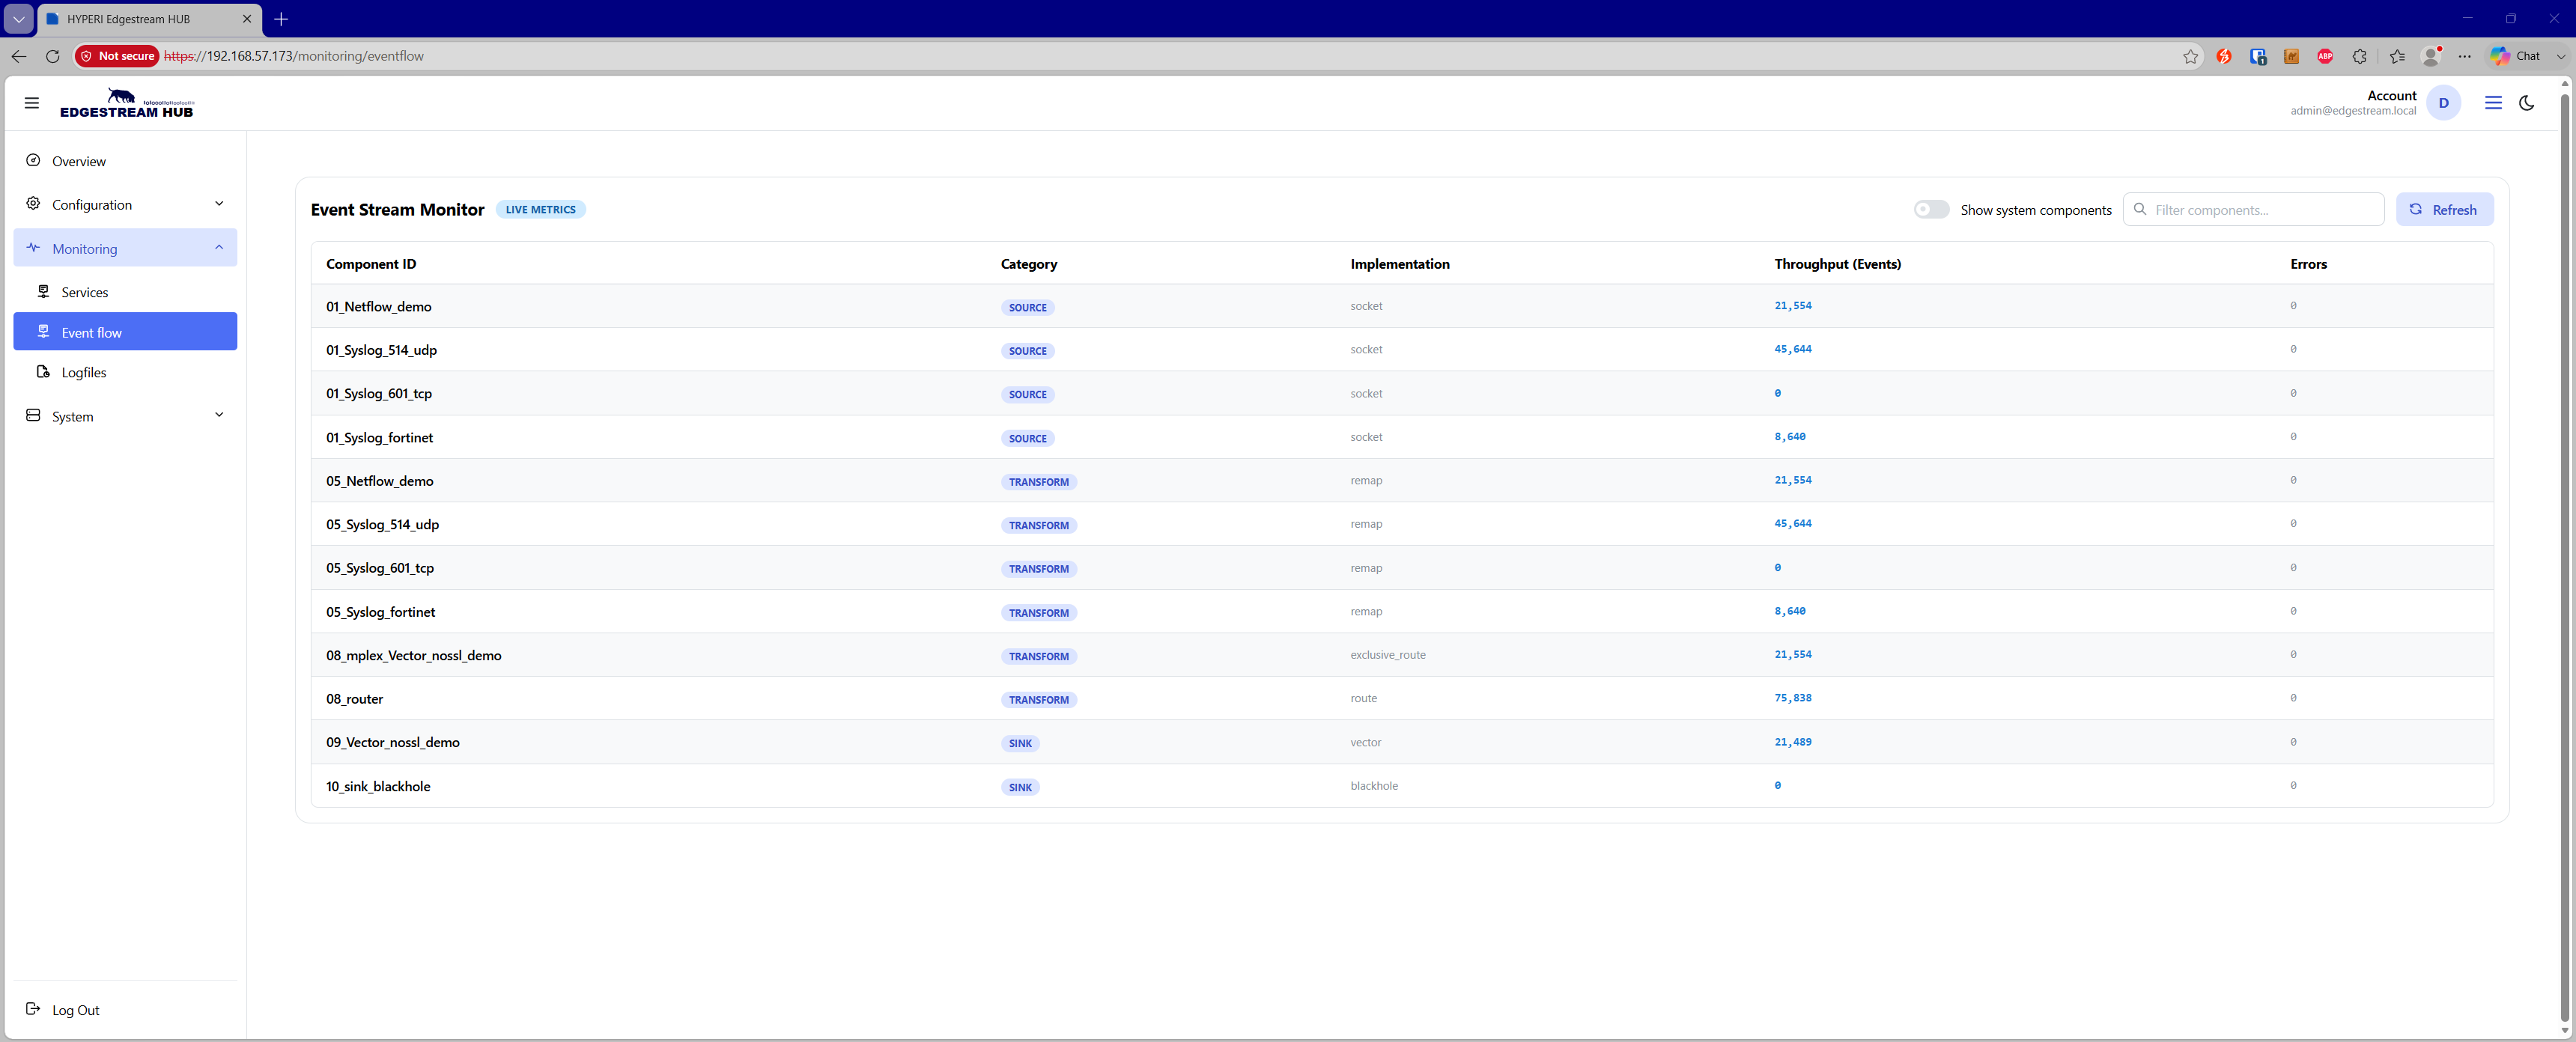
🧭 Overview & Controls
The Event Flow interface offers direct insight into the health and volume of individual pipeline stages.
Controls include:
Show System Components — Toggles the display of internal telemetry pipelines (components prefixed with
00_), such as appliance health monitors and internal logging services.Filter Components — Real-time text search across component names, types, and implementations.
Refresh — Manually triggers an immediate data refresh from the event monitor API.
Stream Status Badge — Highlights whether the pipeline metrics stream is currently live or offline.
📊 Pipeline Metrics Breakdown
The monitor displays data across five key metrics for every active pipeline element:
Component ID — The unique identifier assigned to the pipeline component.
Category — The stage within the processing pipeline (
Source,Transform, orSink/Destination).Implementation — The underlying driver or protocol powering the component (e.g.,
syslog,remap,elasticsearch,kafka).Throughput (Events) — The total count of events processed and forwarded by the component.
Errors — Total operational and delivery errors encountered. Components encountering issues are highlighted to streamline troubleshooting.
🔍 Performance Diagnostics
Administrators can sort table columns to rapidly diagnose bottlenecks:
Isolating Failures — Sort by the Errors column to bring failing sources or destinations to the top.
Locating Bottlenecks — Compare throughput across sequential transforms to locate filtering drop-offs or processing lag.
Auditing Load — Sort by Throughput to identify high-volume feeds requiring load balancing or multiplexing.