📊 Overview
The Overview provides a real-time snapshot of the current operational state of the EdgeStream Hub.
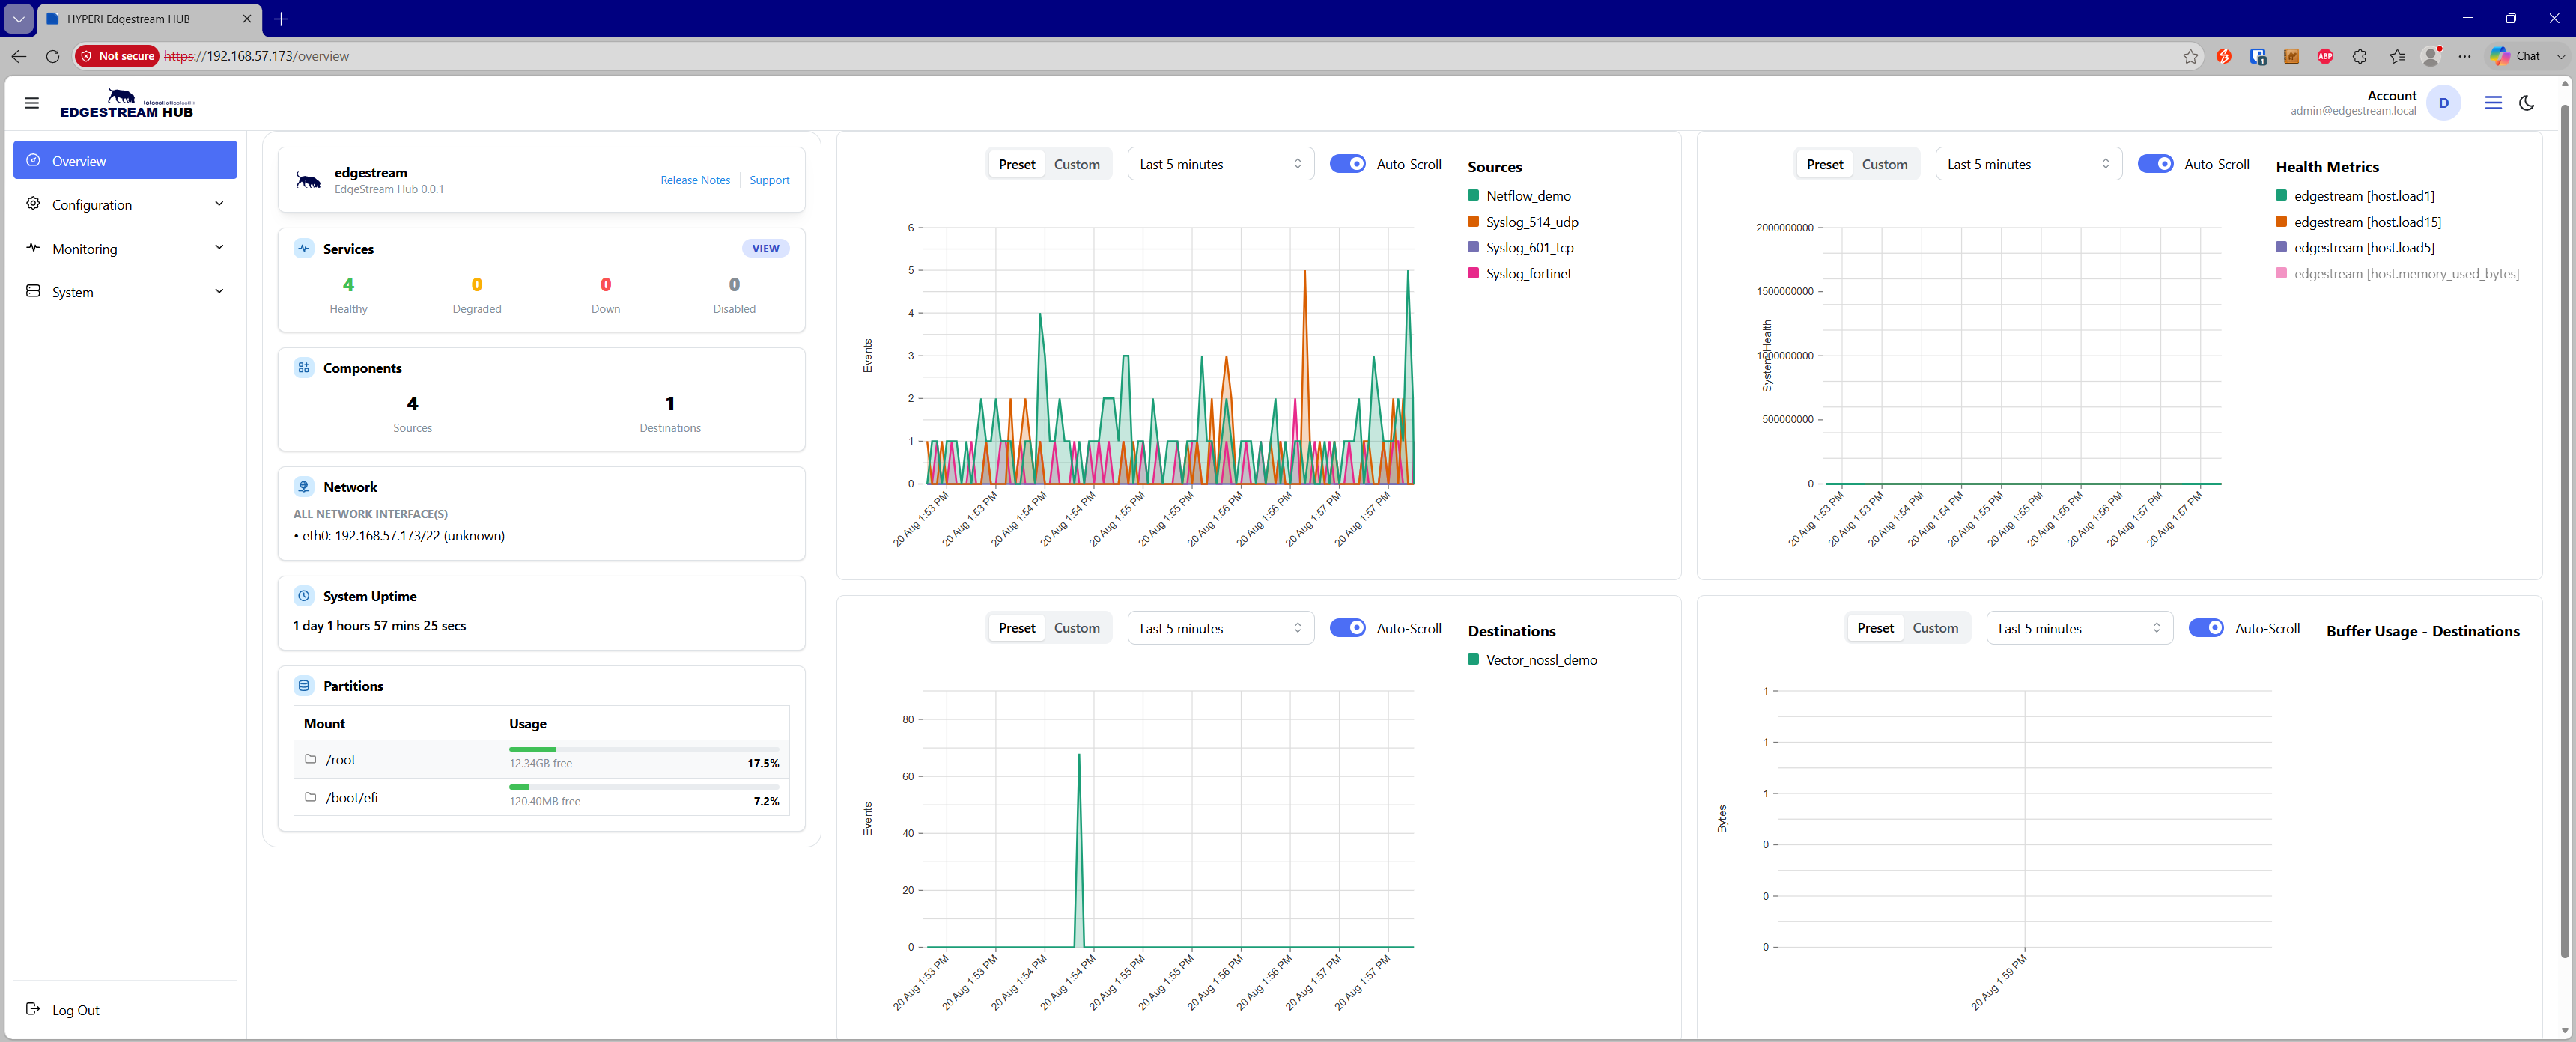
🧩 Dashboard Sections
⚙️ Services
The Services panel displays the current health and operational status of core EdgeStream Hub services.
Services include:
Vector — Observability pipeline engine
Syslog-NG — Enhanced syslog collection daemon
Scheduler — Executes scheduled configuration backups and maintenance tasks
Flow Collector — NetFlow/IPFIX collection service
🔌 Components
Displays currently enabled sources, transforms, and destinations configured within the telemetry pipeline.
🌐 Network
Provides an overview of configured network interfaces, addresses, routing, and connectivity settings.
💾 Partitions
Displays disk partition usage, storage allocation, and available capacity across the appliance.
📈 Graphs and Metrics
Dashboard graphs support real-time auto-scrolling and configurable historical time-range selection.
Telemetry and metric data is stored in an InfluxDB database and is automatically cleaned based on retention and disk utilization policies.
📥 Source Events
Displays the number of events received per configured source over time.
This graph helps administrators identify incoming traffic patterns, source activity levels, and ingestion spikes.
📤 Destination Events
Displays the number of events delivered per configured destination over time.
When multiplexing is enabled, event delivery can be balanced across multiple worker threads per destination to improve throughput and scalability.
❤️ Health Metrics
Displays core appliance health metrics including:
System load
CPU utilization
Memory usage
Syslog-NG message loss statistics
Internal pipeline health metrics
🗄️ Buffer Usage
Displays memory and disk buffer utilization for configured destinations.
This allows administrators to identify backpressure, delivery delays, or downstream destination performance issues.